Replication Analysis
Replication Framework
- Replication Framework: (Simulation) Automated multi-run experiments with confidence intervals
📊 Running the full simulation (multiple replications)
Runs multiple independent replications, aggregates results, and computes confidence intervals and statistical analysis.
desk-sim -m examples/hospital.py --mode replications
Performance Metrics
- Entity Metrics: System time, queue time, service time
- Resource Metrics: Utilization, queue length, busy/idle time
-
WIP Tracking: Time-weighted work-in-process analysis
-
Automated Reports: Simulation results with diagnostics and recommendations
(Report for the example hospital.py)
EXECUTING 30 REPLICATIONS...
==================================================
Replication 1/30 (seed: 12345)
Replication 2/30 (seed: 13345)
Replication 3/30 (seed: 14345)
Replication 4/30 (seed: 15345)
Replication 5/30 (seed: 16345)
Progress: 5/30 | Estimated time remaining: 0.1 min
Replication 6/30 (seed: 17345)
Replication 7/30 (seed: 18345)
Replication 8/30 (seed: 19345)
Replication 9/30 (seed: 20345)
Replication 10/30 (seed: 21345)
Progress: 10/30 | Estimated time remaining: 0.1 min
Replication 11/30 (seed: 22345)
Replication 12/30 (seed: 23345)
Replication 13/30 (seed: 24345)
Replication 14/30 (seed: 25345)
Replication 15/30 (seed: 26345)
Progress: 15/30 | Estimated time remaining: 0.1 min
Replication 16/30 (seed: 27345)
Replication 17/30 (seed: 28345)
Replication 18/30 (seed: 29345)
Replication 19/30 (seed: 30345)
Replication 20/30 (seed: 31345)
Progress: 20/30 | Estimated time remaining: 0.0 min
Replication 21/30 (seed: 32345)
Replication 22/30 (seed: 33345)
Replication 23/30 (seed: 34345)
Replication 24/30 (seed: 35345)
Replication 25/30 (seed: 36345)
Progress: 25/30 | Estimated time remaining: 0.0 min
Replication 26/30 (seed: 37345)
Replication 27/30 (seed: 38345)
Replication 28/30 (seed: 39345)
Replication 29/30 (seed: 40345)
Replication 30/30 (seed: 41345)
Progress: 30/30 | Estimated time remaining: 0.0 min
REPLICATIONS COMPLETED in 0.1 minutes
Average time per replication: 0.2 seconds
================================================================================
STATISTICAL RESULTS (30 REPLICATIONS)
================================================================================
SYSTEM METRICS:
----------------------------------------
Average time in the system:
Average: 19.46 +/- 0.62
CI 95%: [18.84, 20.08]
Precision: +/-3.18%
Standard Deviation: 1.66
Min-Max: [17.65, 23.35]
Entities processed:
Average: 330.67 +/- 7.71
CI 95%: [322.96, 338.38]
Precision: +/-2.33%
Standard Deviation: 20.65
Min-Max: [299.00, 379.00]
Throughput (entities/min):
Average: 0.25 +/- 0.01
CI 95%: [0.24, 0.26]
Precision: +/-2.33%
Standard Deviation: 0.02
Min-Max: [0.23, 0.29]
ACTIVITY METRICS:
----------------------------------------
Consultation Queue Time:
Average: 1.88 +/- 0.35
CI 95%: [1.53, 2.23]
Precision: +/-18.61%
Standard Deviation: 0.94
Min-Max: [0.96, 4.80]
Consultation Service Time:
Average: 9.94 +/- 0.07
CI 95%: [9.87, 10.02]
Precision: +/-0.75%
Standard Deviation: 0.20
Min-Max: [9.66, 10.33]
Consultation System Time:
Average: 11.83 +/- 0.38
CI 95%: [11.44, 12.21]
Precision: +/-3.23%
Standard Deviation: 1.02
Min-Max: [10.72, 14.92]
Pharmacy Queue Time:
Average: 1.28 +/- 0.19
CI 95%: [1.09, 1.47]
Precision: +/-14.94%
Standard Deviation: 0.51
Min-Max: [0.56, 3.13]
Pharmacy Service Time:
Average: 4.99 +/- 0.11
CI 95%: [4.88, 5.10]
Precision: +/-2.22%
Standard Deviation: 0.30
Min-Max: [4.39, 5.56]
Pharmacy System Time:
Average: 6.27 +/- 0.26
CI 95%: [6.01, 6.53]
Precision: +/-4.14%
Standard Deviation: 0.69
Min-Max: [5.13, 8.42]
Triage Queue Time:
Average: 2.17 +/- 0.19
CI 95%: [1.99, 2.36]
Precision: +/-8.55%
Standard Deviation: 0.50
Min-Max: [1.41, 3.63]
Triage Service Time:
Average: 2.51 +/- 0.01
CI 95%: [2.50, 2.51]
Precision: +/-0.22%
Standard Deviation: 0.02
Min-Max: [2.47, 2.54]
Triage System Time:
Average: 4.68 +/- 0.19
CI 95%: [4.49, 4.86]
Precision: +/-3.99%
Standard Deviation: 0.50
Min-Max: [3.90, 6.14]
USE OF RESOURCES:
----------------------------------------
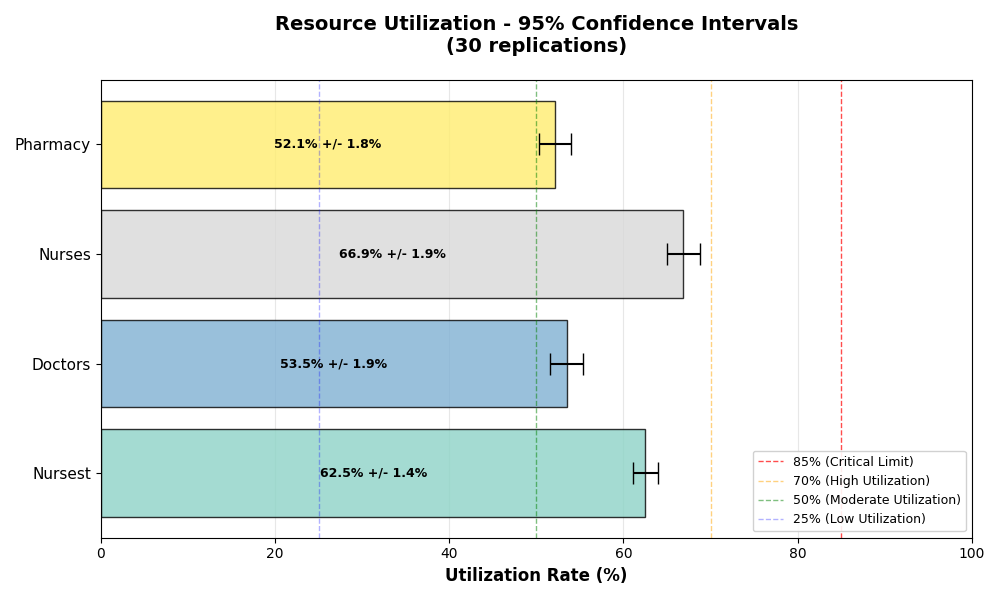
Utilization rate - doctors:
Average: 53.49% +/- 1.91
CI 95%: [51.59, 55.40]%
Precision: +/-3.56%
Standard Deviation: 5.10
Min-Max: [46.53, 67.52]%
Utilization rate - nursesT:
Average: 62.53% +/- 1.43
CI 95%: [61.10, 63.95]%
Precision: +/-2.28%
Standard Deviation: 3.82
Min-Max: [55.82, 70.77]%
Utilization rate - nurses:
Average: 66.89% +/- 1.91
CI 95%: [64.98, 68.80]%
Precision: +/-2.85%
Standard Deviation: 5.11
Min-Max: [59.50, 78.81]%
Utilization rate - pharmacy:
Average: 52.13% +/- 1.82
CI 95%: [50.32, 53.95]%
Precision: +/-3.48%
Standard Deviation: 4.86
Min-Max: [43.47, 61.12]%
PRECISION ANALYSIS:
----------------------------------------
High precision (<=5%): 35 metrics
Medium precision (5-10%): 9 metrics
Low precision (>10%): 10 metrics
Metrics with low precision (consider more replications):
doctors_avg_queue: 43.5%
nurses_avg_queue: 27.4%
final_wip: 22.2%
pharmacy_avg_queue: 22.0%
Consultation_queue_time: 18.6%
Pharmacy_queue_time: 14.9%
nursesT_avg_queue: 12.9%
doctors_max_queue: 12.8%
nursesT_max_queue: 10.6%
nurses_max_queue: 10.0%
Number of replications: 30
Confidence level: 95%
Recommendation: Good accuracy - consider more replications for critical metrics
DETAILED ANALYSIS OF RESOURCE UTILIZATION:
=======================================================
Nursest:
Mean utilization: 62.5% +/- 1.4%
CI 95%: [61.1%, 64.0%]
Relative precision: +/-2.3%
RECOMMENDATION: Moderate and efficient use
Ideal level for most systems
Doctors:
Mean utilization: 53.5% +/- 1.9%
CI 95%: [51.6%, 55.4%]
Relative precision: +/-3.6%
RECOMMENDATION: Moderate and efficient use
Ideal level for most systems
Nurses:
Mean utilization: 66.9% +/- 1.9%
CI 95%: [65.0%, 68.8%]
Relative precision: +/-2.9%
RECOMMENDATION: Moderate and efficient use
Ideal level for most systems
Pharmacy:
Mean utilization: 52.1% +/- 1.8%
CI 95%: [50.3%, 54.0%]
Relative precision: +/-3.5%
RECOMMENDATION: Moderate and efficient use
Ideal level for most systems
Results exported to results/framework_results.csv
entities_processed system_time_avg ... Consultation_total_cost Pharmacy_total_cost
count 30.000000 30.000000 ... 30.000000 30.000000
mean 330.666667 19.457024 ... 39996.952288 8998.969258
std 20.645336 1.655454 ... 2975.884980 683.443079
min 299.000000 17.650379 ... 35318.257545 7890.646810
25% 315.250000 18.291610 ... 37733.148523 8607.144075
50% 330.000000 18.924284 ... 39699.344231 8852.724417
75% 342.250000 20.478045 ... 41471.168983 9481.115028
max 379.000000 23.353643 ... 47035.048976 10447.222585