Examples
🎓 Example Models
1) Hospital Emergency Department
Triage, multiple resources, priority routing, financial tracking (hospital.py)
2) Restaurant Service
Multi-resource activities, dynamic attributes, financials (2.py)
3) Call Center with Lost Calls
Trunk capacity, blocking, retrials, custom KPIs (3.py, 3a.py, 3b.py)
🎓 Running examples
For each example, you can run: (1) replication, (2) full simulation, (3) factorial analysis and (4) visualization.
DESK examples are executed directly from the command line, using explicit execution modes.
🔍 List available modes
To list the execution modes for a given model, e.g., hospital.py, type:
desk-sim -m examples/hospital.py --list-modes
DESK execution modes:

  --mode single         → run a single replication
  --mode replications   → run the full simulation
  --mode factorial      → run a factorial analysis
  --mode visualization  → run simulation interface
🔁 Interactive visualization
Runs the model using the DESK visualization interface, enabling interactive inspection of the evolving system.
desk-sim -m examples/hospital.py --mode visualization
▶️ Running a single replication
Runs one complete replication run, with full tracing, reporting, plots, and diagnostics.
desk-sim -m examples/hospital.py --mode single
📊 Running the full simulation (multiple replications)
Runs multiple independent replications, aggregates results, and computes confidence intervals and statistical analysis.
desk-sim -m examples/hospital.py --mode replications
🧪 Factorial analysis
Runs a factorial experiment, varying model parameters and analyzing main and interaction effects.
desk-sim -m examples/hospital.py --mode factorial
Simulation Report (example hospital)
============================================================
SIMULATION COMPLETE - ANALYZING RESULTS
============================================================
============================================================
📊 SIMULATION RESULTS (⏳ Duration: 24 hours)
WARM-UP: 2 hours | STATISTICS PERIOD: 22 hours
============================================================
STABILITY INDEX: 1.09
STATUS: Stable system
⏰ Average time in the system: 0.30 horas
👥 Total number of entities processed: 330
⚙️ Throughput: 15.00 entities/hour
📋 Active resources: ['nursesT', 'nurses', 'doctors', 'pharmacy']
NOTE: Statistics based only on the post-warm-up period
(t > 2.0 hours)
WORK IN PROCESS (WIP) METRICS:
Average WIP: 4.65 entities
Maximum WIP: 11 entities
Current WIP: 9 entities
TOTAL TIME IN SYSTEM:
Average: 18.25 time units
Std Dev: 8.59
Min: 2.17
Max: 44.92
Median: 17.87
Based on: 330 entities
LITTLE'S LAW VERIFICATION:
L (Avg WIP): 4.65
lambda (Throughput): 0.2500 entities/time unit
W (Avg Time): 18.25 time units
Expected WIP (lambda * W): 4.56
Difference: 2.0%
Status: Excellent match (Little's Law verified)
Analyzing warm-up period...
🔍 WARM-UP ANALYSIS:
==================================================
📋 nursesT:
System may not be completely stabilized
Final average usage: 43.0%
📋 doctors:
System may not be completely stabilized
Final average usage: 57.0%
📋 nurses:
System may not be completely stabilized
Final average usage: 69.7%
📋 pharmacy:
System may not be completely stabilized
Final average usage: 46.5%
RECOMMENDATIONS:
• Please note the charts to identify when usage stabilizes
• The warm-up period should last at least until the stabilization point
• Use a 20-30% additional margin on the stabilization time
• Complex systems may require a longer warm-up period
==================================================
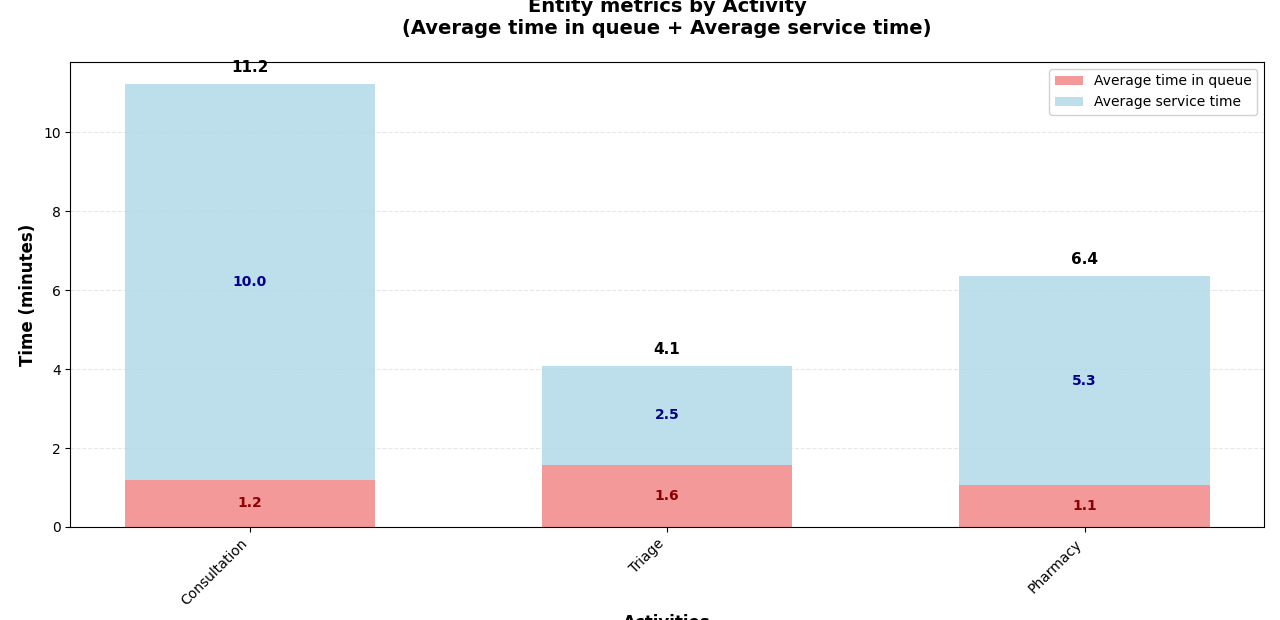
EFFICIENCY ANALYSIS BY ACTIVITY:
=============================================
Consultation:
Total time: 11.2 min
Queue: 1.2 min (10.7%)
Service: 10.0 min (89.3%)
✅ Efficient: only 10.7% of time in queues
Triage:
Total time: 4.1 min
Queue: 1.6 min (38.5%)
Service: 2.5 min (61.5%)
⚠️ ATTENTION: 38.5% of time and waiting in queues
Pharmacy:
Total time: 6.4 min
Queue: 1.1 min (16.7%)
Service: 5.3 min (83.3%)
✅ Efficient: only 16.7% of time in queues
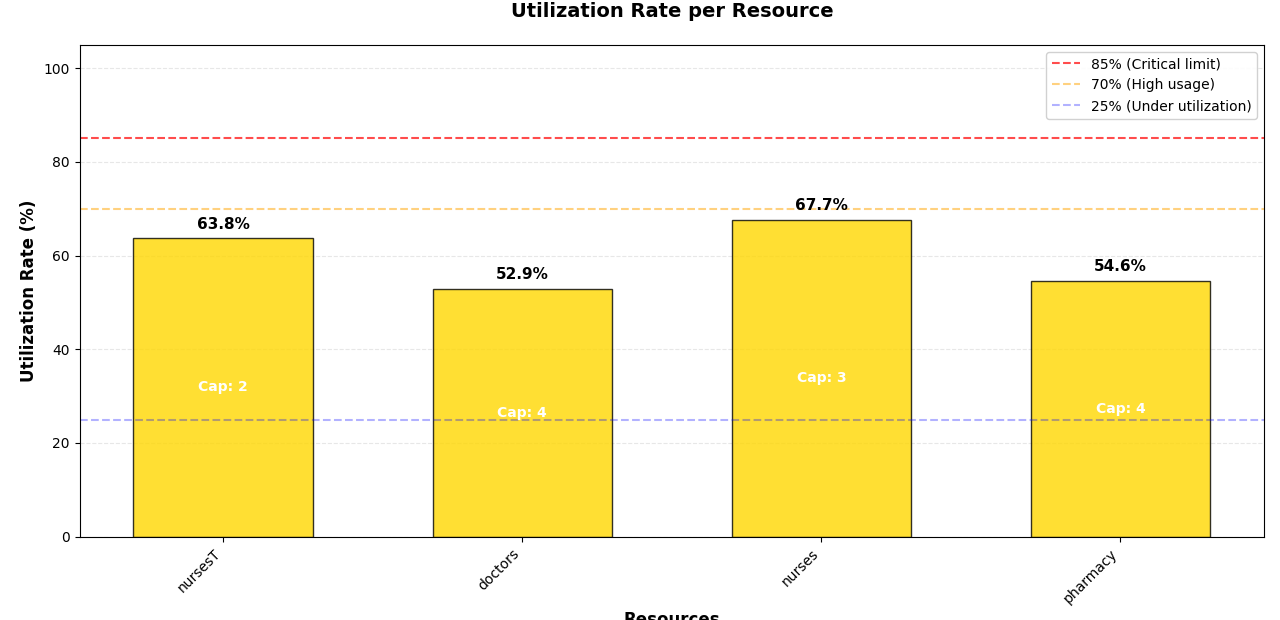
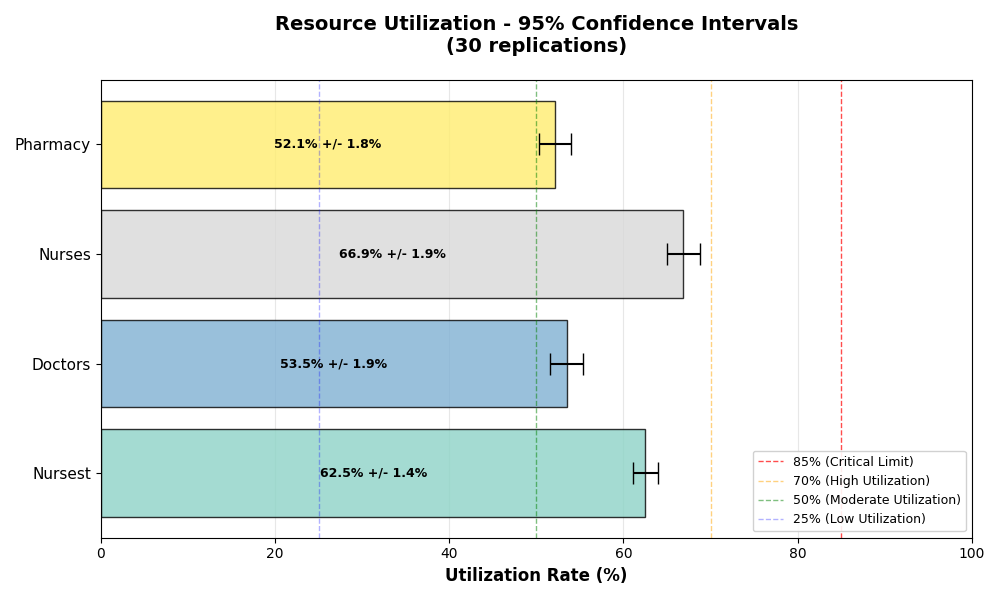
RESOURCE UTILIZATION ANALYSIS:
==========================================
nursesT (Capacity: 2):
Utilization rate: 63.8%
✅ GOOD: Moderate and efficient use
doctors (Capacity: 4):
Utilization rate: 52.9%
✅ GOOD: Moderate and efficient use
nurses (Capacity: 3):
Utilization rate: 67.7%
✅ GOOD: Moderate and efficient use
pharmacy (Capacity: 4):
Utilization rate: 54.6%
✅ GOOD: Moderate and efficient use
==============================================================
RESOURCE CONFIGURATION SUMMARY
==============================================================
Resource: doctors
Type: PriorityResource
Capacity: 4 units
Used by 1 block(s):
- Consultation: 1 units (25% of capacity)
Maximum single allocation: 1 units (25% of capacity)
Resource: nurses
Type: PriorityResource
Capacity: 3 units
Used by 1 block(s):
- Consultation: 1 units (33% of capacity)
Maximum single allocation: 1 units (33% of capacity)
Resource: nursesT
Type: PriorityResource
Capacity: 2 units
Used by 1 block(s):
- Triage: 2 units (100% of capacity)
Maximum single allocation: 2 units (100% of capacity)
Resource: pharmacy
Type: PriorityResource
Capacity: 4 units
Used by 1 block(s):
- Pharmacy: 2 units (50% of capacity)
Maximum single allocation: 2 units (50% of capacity)
==============================================================
📈 METRICS BY RESOURCE:
nursesT (capacity: 2):
Utilization rate: 0.64
Time Busy: 841.69 (63.8%)
Time Idle: 469.63 (35.6%)
Maximum in queue: 10
Maximum in service: 2
Average number in queue: 0.53
Average number in service: 1.28
Analysis (💡): System operating within expected parameters.
doctors (capacity: 4):
Utilization rate: 0.53
Time Busy: 1204.78 (91.3%)
Time Idle: 111.46 (8.4%)
Maximum in queue: 2
Maximum in service: 4
Average number in queue: 0.01
Average number in service: 2.12
Analysis (💡): System operating within expected parameters.
nurses (capacity: 3):
Utilization rate: 0.68
Time Busy: 1204.78 (91.3%)
Time Idle: 111.46 (8.4%)
Maximum in queue: 3
Maximum in service: 3
Average number in queue: 0.09
Average number in service: 2.03
Analysis (💡): System operating within expected parameters.
pharmacy (capacity: 4):
Utilization rate: 0.55
Time Busy: 951.26 (72.1%)
Time Idle: 364.99 (27.7%)
Maximum in queue: 8
Maximum in service: 4
Average number in queue: 0.21
Average number in service: 2.19
Analysis (💡): System operating within expected parameters.
Entities created: 368
Entities disposed: 330
Entities in the system: 38
BLOCK STATISTICS:
Arrivals (CreateBlock):
Triage (ProcessBlock):
Entities processed: 335
Average time in service: 2.51
Average time in queue: 1.64
Consultation (MultiProcessBlock):
Entities processed: 266
Average time in service: 10.03
Average time in queue: 1.23
Pharmacy (ProcessBlock):
Entities processed: 269
Average time in service: 5.30
Average time in queue: 1.07
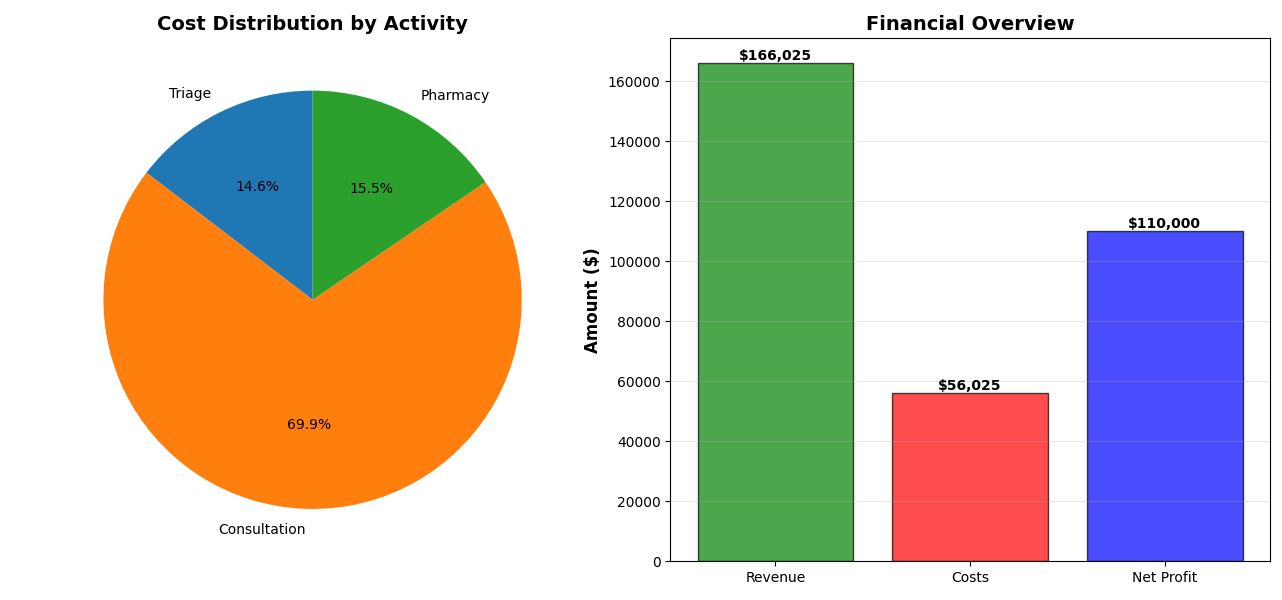
============================================================
FINANCIAL BALANCE SHEET
============================================================
Based on 330 entities (post warm-up)
REVENUE:
Total Revenue: $166,025.33
Average per Entity: $503.11
COSTS BY ACTIVITY:
Consultation: $39,167.39 (69.9%)
Pharmacy: $8,674.93 (15.5%)
Triage: $8,182.62 (14.6%)
Total Costs: $56,024.94
Average per Entity: $169.77
------------------------------------------------------------
NET PROFIT: $110,000.39
Average per Entity: $333.33
Profit Margin: 66.3%
Excellent profit margin
============================================================