DESK — Discrete Event Simulation Kit
![]()
![]()
![]()
![]()
A comprehensive Python framework for Discrete Event Simulation [1,2] with advanced analysis, visualization, and experimental design capabilities.
📋 Overview
DESK (Discrete Event Simulation Kit) is a professional-grade simulation framework built on top of SimPy [3], designed for modeling complex systems such as hospitals, call centers, manufacturing, and service operations.
DESK addresses the gap of structured experimental design [4] and replication automation in discrete-event simulation [1,2] workflows.
The open-source framework [5] emphasizes: - modularity, - reusability, - transparency (visualization and event logs), - and statistical analysis.
DESK is suitable for applied decision support, teaching, and research.
✨ Key Features
Core Simulation Engine
- Modular Block Architecture: Reusable building blocks (
CREATE,PROCESS,DECIDE,DISPOSE) - Advanced Resource Management: Regular, priority-based, and preemptive resources
- Entity Attributes & State Variables: Dynamic assignment and modification
- Priority Scheduling: Activity-level and entity-level priority control
- Event Tracing: Event logging with filtering and replay
- Visualization: Graphical interface synchronized with event log printing
Input Analysis (desk-distfit)
- DistFit Tool: Automated distribution fitting with statistical tests (
desk-distfit) - Supports 9+ distributions:
- uniform, triangular, exponential, normal, lognormal, beta, gamma, Weibull
- Kolmogorov–Smirnov goodness-of-fit tests
- Multiple output formats: table, JSON, CSV
See DESK Distribution Fitting Tool for further details.
Experimental Design & Analysis
- Stability Analysis: Preliminary capacity analysis on utilization (ρ < 1)
- Little’s Law verification: Automatic analysis on stability (L = λW). The average number of items in the system (L) is the average arrival rate (λ) multiplied by the average time an item spends in the system (W)
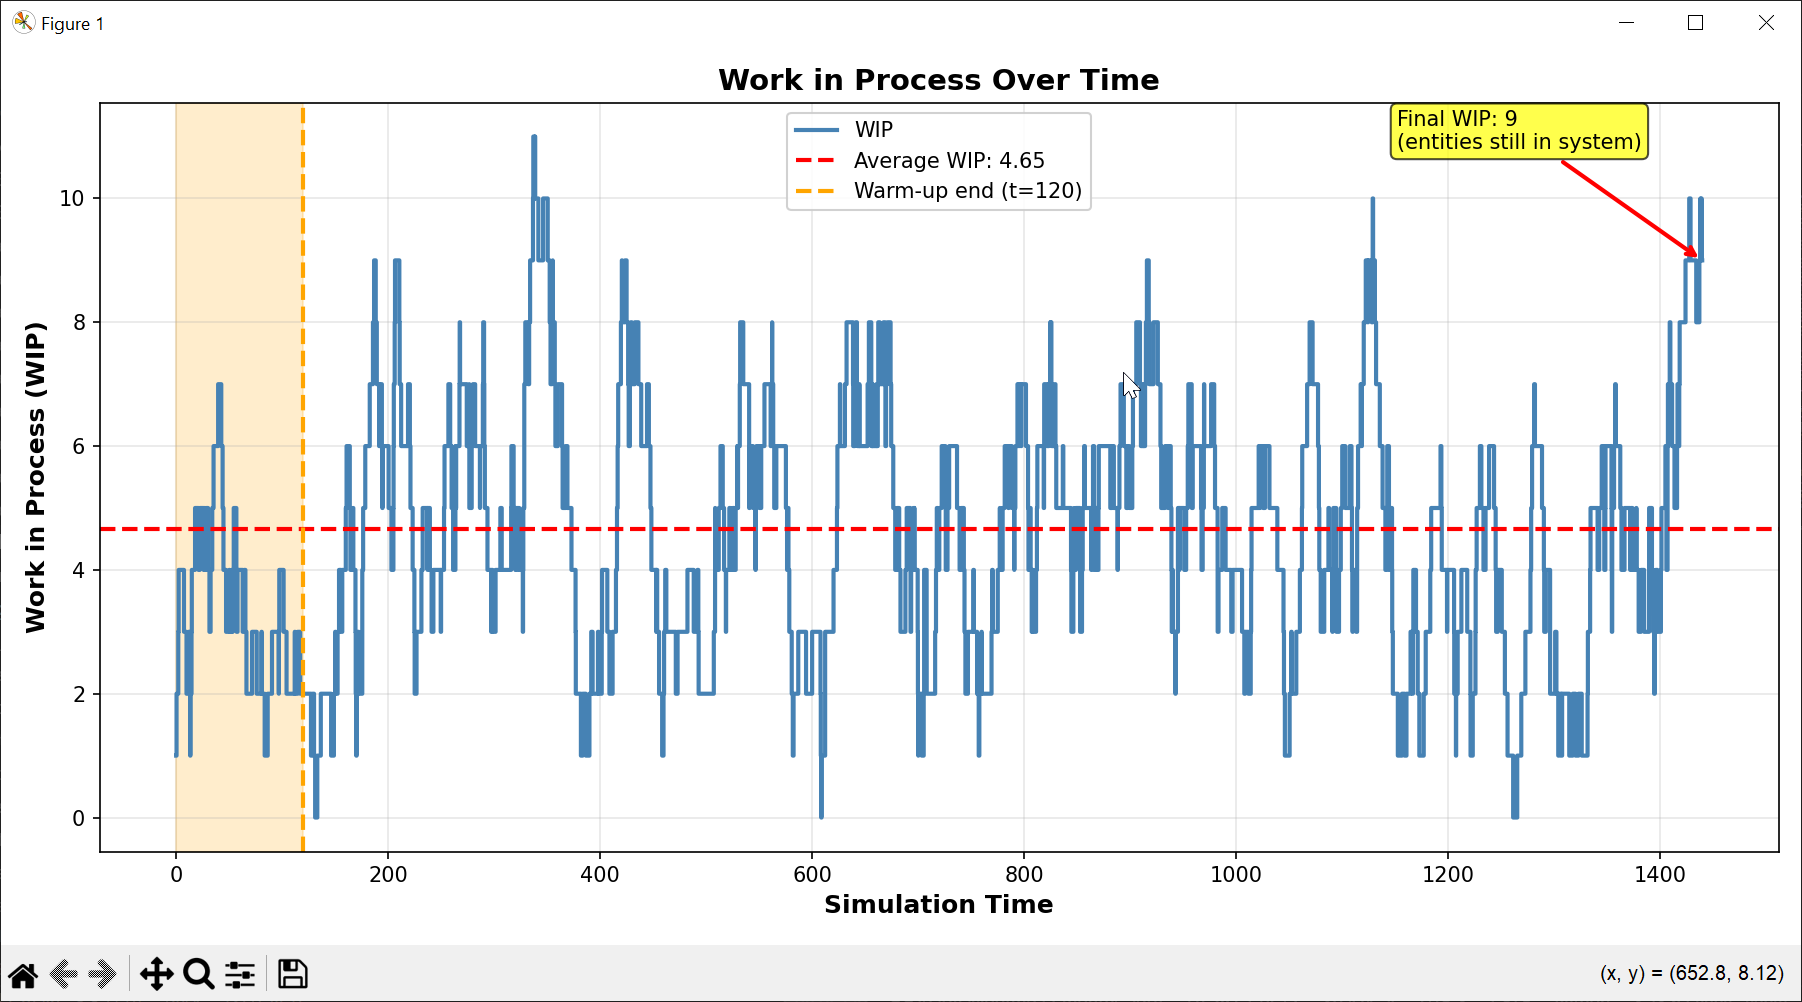
- Warm-Up Analysis: Automated transient detection
- Replication Framework: (Simulation) Automated multi-run experiments with confidence intervals
- Factorial Experiments: Full factorial design with interaction analysis
Performance Metrics
- Entity Metrics: System time, queue time, service time
- Resource Metrics: Utilization, queue length, busy/idle time
- WIP Tracking: Time-weighted work-in-process analysis
- Financial Analysis: Cost and revenue per activity
Visualization & Reporting
- Real-Time Visualization: Process animation during simulation

- Statistical Plots:
- Resource utilization over time
- WIP evolution
- System time distributions
- Activity-level metrics
- BupaR Integration: Process mining and animation files for ProcessAnimate in R (processanimateR).
- Automated Reports: Simulation results with diagnostics and recommendations
🚀 Quick Start
🪟 Windows (PowerShell / VS Code / Cursor )
1) Clone the DESK repository
git clone https://github.com/joaoflavioufmg/desk.git
2) Enter the project directory
cd desk
3) Create a virtual environment
py -3.13 -m venv venv
4) Allow PowerShell to activate virtual environments (run once per machine)
Set-ExecutionPolicy -ExecutionPolicy RemoteSigned -Scope CurrentUser
5) Activate the virtual environment
.\venv\Scripts\Activate.ps1
6) Upgrade pip inside the virtual environment
py -m pip install --upgrade pip
7) Install DESK and its dependencies
pip install .
8) Verify that DESK and DESK-DISTFIT were installed correctly
desk-sim -h
desk-distfit -h
9) Run the hospital example with visualization
desk-sim -m examples/hospital.py --mode visualization
10) Run desk-distfit with some data
desk-distfit -d input_data/data10.txt
DESK — Discrete Event Simulation Kit
🚀 Basic Example
Patients arrive at a hospital emergency department, where they are assessed through a triage system and then directed to the appropriate hospital units. The conceptual model is presented* below.
*DESK adopts BPMN (.bpmn) as an open, tool-independent notation for representing activity-cycle and process-interaction models. Although BPMN is not a simulation-native language, its standardized semantics and widespread support make it a suitable representation for discrete-event simulation models.
Models in .bpmn format can be created and shared using the
BPMN Web Modeler (bpmn.io).
(A single replication)
Create a basic.py file and Copy/Paste the Part1 code below.
Following, run: desk-sim -m basic.py --mode single
# ==============================================================
# Part 1: Basic simulation model: Nurses on emergency triage (hospital)
# ==============================================================

def build_model(until=None, event_logger=None, verbose=True):

    import random
    from desk.core.simulation_model import SimulationModel
    from desk.core.entity import EventLogger
    from desk.blocks.create_block import CreateBlock
    from desk.blocks.process_block import ProcessBlock
    from desk.blocks.dispose_block import DisposeBlock

    # Create model
    model = SimulationModel(verbose=verbose)

    # Add resources
    nurses = model.add_resource("Nurses", capacity=3)

    # Define blocks
    arrivals = CreateBlock(
        "Arrivals", model.env,
        inter_arrival_time=lambda: random.expovariate(1/10),
        entity_prefix="Patient",
        event_logger=event_logger
    )

    triage = ProcessBlock(
        "Triage", model.env,
        resource=nurses,
        delay_time=lambda: random.uniform(5, 10),
        resource_units=1,
        event_logger=event_logger
    )

    discharge = DisposeBlock("Discharge", model.env, event_logger=event_logger)

    # Register blocks
    for block in [arrivals, triage, discharge]:
        model.add_block(block)

    # Connect flow
    arrivals.connect_to(triage)
    triage.connect_to(discharge)

    return model


# Run a simulation replication
def main():
    from desk.core.entity import EventLogger

    HOURS = 60  # Time conversion factor (base time: minutes)
    DAYS = 1440
    YEARS = 525600

    # Create event logger
    event_logger = EventLogger()

    model = build_model(event_logger=event_logger, verbose=False)

    model.run_simulation(
        until=8*HOURS,          # 8 hours
        warm_up_period=1*HOURS,  # 1 hour
        seed=123
    )

    # Report results
    from desk.analytics.reporting import SimulationReporter
    reporter = SimulationReporter(model)
    reporter.print_results()
    reporter._print_activity_metrics()
    reporter._print_resource_metrics()
    reporter._print_entity_counts()
    reporter._print_block_statistics()

    return model, event_logger

# ===========================================
# Simulation Kit
# ===========================================

# Run a simulation replication
def run_single_replication():
    return main()

# Run a full simulation
def run_replications_cli():
    run_replications()

# Run a factorial analysis
def run_factorial_cli():
    return factorial_analysis()

# Run the simulation with interface
def run_visualization_cli(simulation_time=500):
    return run_visualization(build_model, simulation_time=simulation_time)
📊 Simulation Analysis (Replications)
Now, Copy/Paste the Part2 code below and add to the basic.py file.
Following, run: desk-sim -m basic.py --mode replications
# ... (after) "return model, event_logger"...
# ==============================================================
# Part 2: Additional code: Full simulation (replications framework)
# ==============================================================

# Define simulation function wrapper
def simulation_wrapper(seed=None, until=None, warm_up_period=None):
    """Wrapper function for replication framework."""

    from desk.core.entity import EventLogger
    event_logger = EventLogger()

    # Create a fresh model
    model = build_model(until=until, event_logger=event_logger, verbose=False)

    model.run_simulation(
        validate_resources=False,
        until=until,
        seed=seed,
        warm_up_period=warm_up_period
    )

    return model

def run_replications():
    from desk.stats.replication import ReplicationFramework

    replication_framework = ReplicationFramework(
        simulation_function=simulation_wrapper,
        n_replications=30
    )

    HOURS = 60  # Time conversion factor (base time: minutes)
    DAYS = 1440
    YEARS = 525600

    replication_framework.run_replications(
        base_seed=12345,
        until=8*HOURS,
        warm_up_period=1*HOURS
    )

    # Access results
    df = replication_framework.get_results_dataframe()
    print(df.describe())

# ... keep the original (Simulation Kit) code
# ===========================================
# Simulation Kit
# ===========================================
🧪 Experimental Design (Factorial)
Now, Copy/Paste the Part3 code below and add to the basic.py file.
Following, run: desk-sim -m basic.py --mode factorial
# ... after "print(df.describe())"...
# ==============================================================
# Part 3: Additional code: Factorial experiment
# ==============================================================
def factorial_analysis():
    """Factorial analysis with simulation."""

    from desk.stats.factorial import FactorialExperiment

    HOURS = 60  # Time conversion factor (base time: minutes)
    DAYS = 1440
    YEARS = 525600


    def simulation_wrapper(arrival_rate=1, num_nurses=1,
                                seed=None, until=None, warm_up_period=0, **kwargs):
        """Wrapper that adapts parameters for factorial analysis."""

        from desk.core.entity import EventLogger
        event_logger = EventLogger()

        # Create a fresh model
        model = build_model(until=until, event_logger=event_logger, verbose=False)

        model.run_simulation(
            validate_resources=False,
            until=until,
            seed=seed,
            warm_up_period=warm_up_period
        )

        return model

    # Create factorial analysis
    factorial = FactorialExperiment(
        simulation_function=simulation_wrapper,
        base_seed=12345
    )

    # Add factors
    factorial.add_factor(
        factor_name='arrival_rate',
        parameter_path='CreateBlock.inter_arrival_time',
        levels=[1, 2, 3],  # Minutes between arrivals
        description='Inter arrival rates (min)'
    )

    factorial.add_factor(
        factor_name='num_nurses',
        parameter_path='Resource.nurses.capacity',
        levels=[1, 2, 3],
        description='Number of nurses'
    )

    # Run experiment
    factorial.run_factorial_experiment(
        n_replications=5,
        simulation_time=4*HOURS,  # 4 hours
        warm_up_period=1/2*HOURS,    # 1/2 hour
        verbose=True
    )

    # Analyze results
    factorial.print_summary()
    factorial.plot_correlation_matrix()
    factorial.plot_main_effects('system_time_avg')
    factorial.plot_interaction_effects('system_time_avg', 'arrival_rate', 'num_nurses')

    return factorial

# ... keep the original (Simulation Kit) code
# ===========================================
# Simulation Kit
# ===========================================
🔁 Run Interface (Visualization)
Finally, Copy/Paste the Part4 code below and add to the basic.py file.
Following, run: desk-sim -m basic.py --mode visualization
Actually, this can be the first part in a simulation study.
# ... after "return factorial"...
# ==============================================================
# Part 4: Additional code: Interface - visualization
# ==============================================================
from desk.visualization.interface import run_visualization

# ... keep the original (Simulation Kit) code
# ===========================================
# Simulation Kit
# ===========================================
📂 Project Structure
DESK/
├── src/                       # Source code of DESK
|   ├── config/                # Simulation setting
|   ├── core/                  # Core simulation engine
|   ├── blocks/                # Simulation building blocks
|   ├── analytics/             # Metrics, plots, reports
|   ├── stats/                 # Replication & factorial design
|   ├── validation/            # Stability and warm-up analysis
|   ├── visualization/         # Real-time visualization
|   ├── distfit/distfit.py     # DistFit CLI tool
├── input_data/
├── examples/
├── 1) hospital.py             # Hospital example
├── 2) 2.py                    # Restaurant example
├── 3) 3.py, 3a.py, 3b.py      # Call center (and variations 3a, 3b)
└── README.md
🎓 Example Models
1) Hospital Emergency Department
Triage, multiple resources, priority routing, financial tracking (hospital.py)
2) Restaurant Service
Multi-resource activities, dynamic attributes, financials (2.py)
3) Call Center with Lost Calls
Trunk capacity, blocking, retrials, custom KPIs (3.py, 3a.py, 3b.py)
🎓 Running examples
For each example, you can run: (1) replication, (2) full simulation, (3) factorial analysis and (4) visualization.
DESK examples are executed directly from the command line, using explicit execution modes.
🔍 List available modes
To list the execution modes for a given model, e.g., hospital.py, type:
desk-sim -m examples/hospital.py --list-modes
DESK execution modes:

  --mode single         → run a single replication
  --mode replications   → run the full simulation
  --mode factorial      → run a factorial analysis
  --mode visualization  → run simulation interface
🔁 Interactive visualization
Runs the model using the DESK visualization interface, enabling interactive inspection of the evolving system.
desk-sim -m examples/hospital.py --mode visualization
▶️ Running a single replication
Runs one complete replication run, with full tracing, reporting, plots, and diagnostics.
desk-sim -m examples/hospital.py --mode single
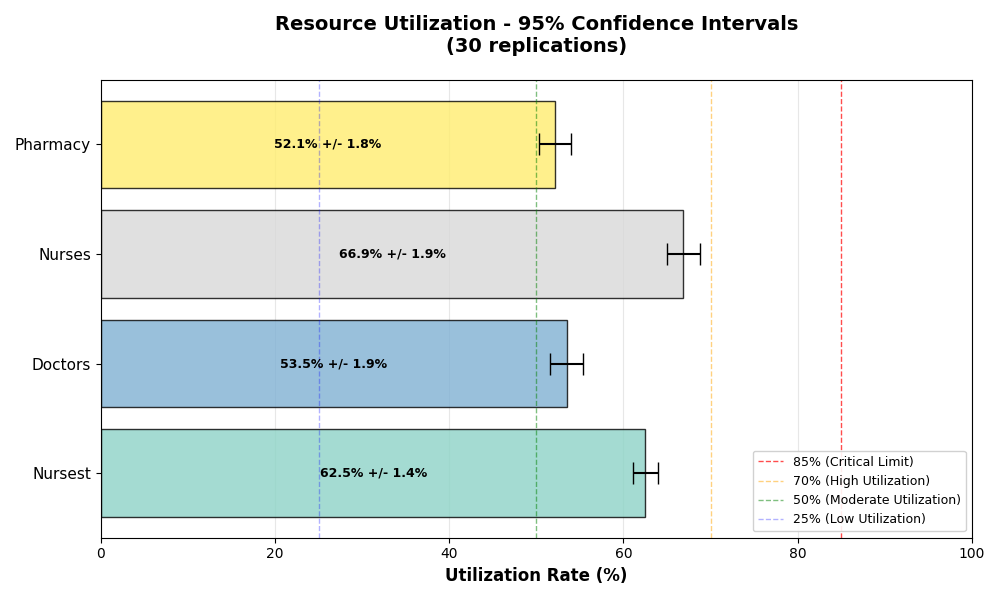
📊 Running the full simulation (multiple replications)
Runs multiple independent replications, aggregates results, and computes confidence intervals and statistical analysis.
desk-sim -m examples/hospital.py --mode replications
🧪 Factorial analysis
Runs a factorial experiment, varying model parameters and analyzing main and interaction effects.
desk-sim -m examples/hospital.py --mode factorial
🔬 Validation & Verification
DESK includes:
- Stability checker (utilization ρ < 1)
- Little’s Law analysis
- Resource consistency validation
- Automated warm-up suggestion
🛠️ Requirements
- Python >= 3.10
- simpy == 4.1.1
- numpy == 2.2.6
- pandas == 2.3.1
- scipy == 1.15.3
- matplotlib == 3.10.5
Optional (for process mining):
- R >= 4.0
- BupaR
- processanimateR
The resulting event-log .csv file is stored in result/ folder, e.g., hospital_event_log.csv file, to produce the animation below. The R code of the example (hospital_bupar.R) is available in r_animation/ folder.
DESK Distribution Fitting Tool (Desk-DistFit)
📊 Input Analysis with Desk-DistFit
How were the input models used in the previous example, such as random.expovariate(1/10) or random.uniform(5, 10), derived from empirical data?
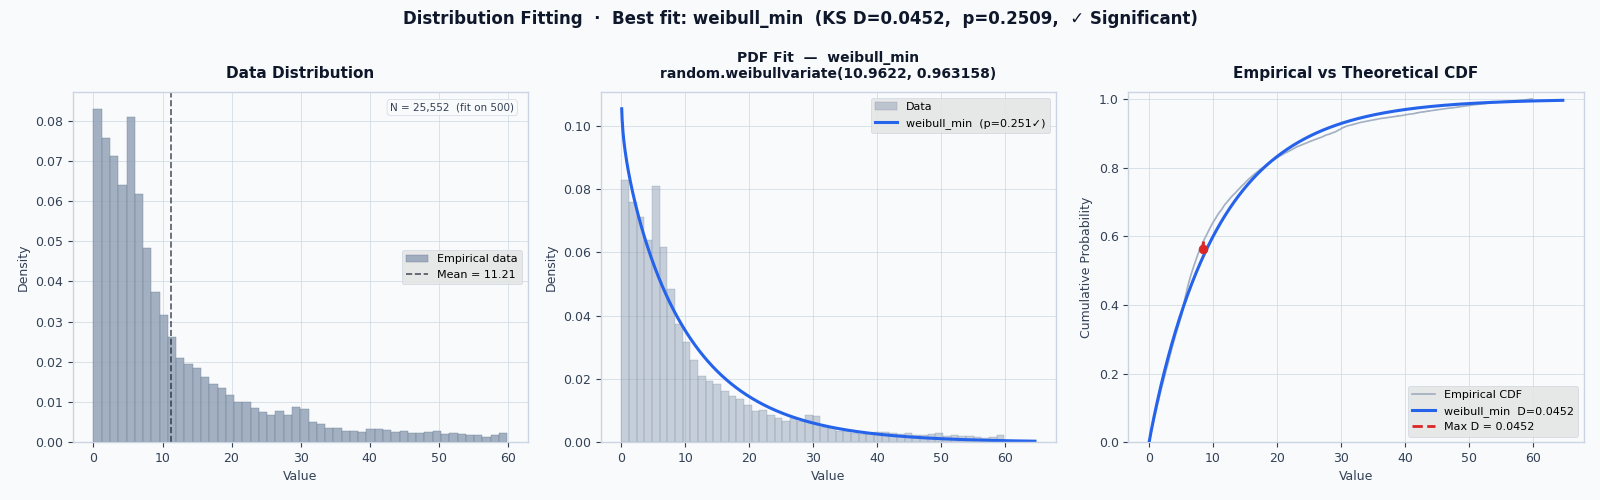
Desk DistFit (desk-distfit) is a Python tool for fitting probability distributions to empirical data using statistical tests. Inspired by previous works [6,7], this tool helps identify the best-fitting probability distribution from a set of common distributions and provides Python code for generating random numbers from the fitted distribution to DESK models.
Within DESK, desk-distfit addresses this question by performing statistical input analysis, identifying the probability distribution that best fits observed data and replacing generic assumptions with data-driven, statistically validated simulation inputs.
desk-distfit is the official DESK input-analysis CLI for statistically fitting probability distributions to empirical data.
DESK adopts a verb-oriented command-line interface, where simulation tasks are expressed as structured actions (desk-distfit), ensuring consistency, reproducibility, and ease of learning across the framework.
Features
- Multiple Distribution Support: Tests 9 common probability distributions (uniform, triangular, exponential, normal, lognormal, beta, gamma, Weibull)
- Statistical Testing: Uses Kolmogorov-Smirnov test for goodness-of-fit assessment
- Command-Line Interface: Easy-to-use CLI with comprehensive options
- Multiple Output Formats: Results can be saved as table, CSV, or JSON
- Visualization: Generates comparative plots of fitted distributions
- Python Code Generation: Automatically generates Python code for the best-fitting distribution
- Robust Error Handling: Comprehensive error handling and logging
Output includes:
- Goodness-of-fit statistics
- Best-fit distribution
- Parameter estimates
- Ready-to-use Python code for DESK models, such as the texts
random.expovariate(1/10)orrandom.uniform(5, 10).
Usage
Basic Usage
Fit probability distributions to empirical data:
# Basic usage
desk-distfit -d input_data/foo.txt

# Custom significance level
desk-distfit -d input_data/foo.txt -a 0.01

# Sizing subsample
desk-distfit -d data.txt --max-sample 500

# Test specific distributions
desk-distfit -d input_data/foo.txt --distributions norm expon gamma

# Save results
desk-distfit -d input_data/foo.txt -o results.txt --format json

# Skip plotting
desk-distfit -d input_data/foo.txt --no-plot

# Help
desk-distfit -h
Command-Line Options
| Option | Description | Default |
|---|---|---|
-d, --data |
Path to data file (required) | - |
-a, --alpha |
Significance level for statistical tests | 0.05 |
-b, --bins |
Number of histogram bins | 50 |
--distributions |
Specific distributions to test | All |
--no-plot |
Skip generating plots | False |
--show-all |
Show all distributions in plot | False |
-o, --output |
Output file path | None |
--format |
Output format (table/csv/json) | table |
-v, --verbose |
Enable verbose logging | False |
-h, --help |
Show help message | - |
Examples
# Basic analysis
desk-distfit -d input_data/foo.txt

# Custom significance level
desk-distfit -d input_data/foo.txt -a 0.01

# Test specific distributions only
desk-distfit -d input_data/foo.txt --distributions norm expon gamma

# Sizing subsample
desk-distfit -d data.txt --max-sample 500

# Save results to file
desk-distfit -d input_data/foo.txt -o results.txt

# Generate CSV output
desk-distfit -d input_data/foo.txt -o results.csv --format csv

# Skip plotting (useful for batch processing)
desk-distfit -d input_data/foo.txt --no-plot

# Show all fitted distributions in plot
desk-distfit -d input_data/foo.txt --show-all

# Verbose output for debugging
desk-distfit -d input_data/foo.txt -v

# Complete example with multiple options
desk-distfit -d input_data/foo.txt -a 0.01 -b 100 --show-all -o results.json --format json -v
Input Data Format
The input file should contain one numeric value per line:
1.234
2.567
0.891
3.456
...
Supported formats: - Plain text files (.txt) - One number per line - UTF-8 encoding - Blank lines are ignored
Supported Distributions
| Distribution | Python Random Function | Parameters |
|---|---|---|
| Uniform | random.uniform(a, b) |
a, b |
| Triangular | random.triangular(low, high, mode) |
low, high, mode |
| Exponential | random.expovariate(lambd) |
lambda |
| Normal | random.gauss(mu, sigma) |
mu, sigma |
| Log-Normal | random.lognormvariate(mu, sigma) |
mu, sigma |
| Beta | random.betavariate(alpha, beta) |
alpha, beta |
| Gamma | random.gammavariate(alpha, beta) |
alpha, beta |
| Weibull (Min) | random.weibullvariate(alpha, beta) |
alpha, beta |
| Weibull (Max) | random.weibullvariate(alpha, beta) |
alpha, beta |
Output
Console Output
The tool provides: 1. Data statistics (sample size, mean, std dev, min, max) 2. Distribution fitting results with p-values and significance indicators 3. Parameter details for all fitted distributions 4. Summary report with best-fitting distribution 5. Python code for generating random numbers for DESK model.
Example Output
Data Statistics:
Sample size: 200
Mean: 2.0156
Std Dev: 2.0298
Min: 0.0089
Max: 11.2445

Item Distribution   Statistic   P-value     Significant
------------------------------------------------------------
1    expon          0.0456      0.8234      (*)
2    gamma          0.0523      0.7891      (*)
3    norm           0.0789      0.4567
...

Distribution Fitting Summary Report
==================================================

Best Fitting Distribution: expon
- Parameters: loc=0.000, scale=2.016
- P-value: 0.8234
- Significant at α=0.05: Yes

Python Random Code:
random.expovariate(0.496)
File Output Formats
Table Format (default)
Human-readable text format with detailed results and parameters.
CSV Format
Distribution,P_value,Statistic,Significant,Python_Code
expon,0.823400,0.045600,Yes,random.expovariate(0.496)
gamma,0.789100,0.052300,Yes,random.gammavariate(1.024,0.496)
...
JSON Format
{
  "summary": {
    "sample_size": 200,
    "best_distribution": "expon",
    "alpha": 0.05
  },
  "results": [
    {
      "distribution": "expon",
      "p_value": 0.8234,
      "statistic": 0.0456,
      "parameters": {"loc": 0.0, "scale": 2.016},
      "significant": true,
      "python_code": "random.expovariate(0.496)"
    }
  ]
}
Interpretation
P-Values
- p ≥ α: Distribution is a good fit (significant)
- p < α: Distribution is not a good fit (reject)
- Higher p-values indicate better fits
Significance Indicators
- (*) asterisk: Indicates significant fit at the chosen α level
- Results are sorted by p-value (best fit first)
Statistical Method
The tool uses the Kolmogorov-Smirnov test [8] to assess goodness-of-fit:
- Null Hypothesis (H₀): The data follows the tested distribution
- Alternative Hypothesis (H₁): The data does not follow the tested distribution
- Test Statistic: Maximum difference between empirical and theoretical CDFs
- Decision Rule: Reject H₀ if p-value < α
Limitations
- Sample Size: Requires sufficient data points (recommended: n ≥ 30)
- Distribution Assumptions: Only tests common continuous distributions
- Parameter Estimation: Uses Maximum Likelihood Estimation (MLE)
- Independence: Assumes data points are independent
- Stationarity: Assumes data comes from a stationary process
Help (DESK and DESK-DistFit)
# Show detailed help
desk-sim -h
desk-distfit -h

# Enable verbose output for debugging
desk-distfit -d input_data/foo.txt -v
Development Setup
# Clone the repository
git clone https://github.com/joaoflavioufmg/desk.git

# Create virtual environment
python -m venv venv
source venv/bin/activate  # On Windows: venv\Scripts\activate

# Install development dependencies
cd desk
pip install .

# Run tests
pytest
References
[1] Banks, J. (2005). Discrete event system simulation. Pearson Education India.
[2] Law, A. M., Kelton, W. D., & Kelton, W. D. (2007). Simulation modeling and analysis (Vol. 3). New York: Mcgraw-hill. ISBN10: 0073401323 | ISBN13: 9780073401324 https://www.mheducation.com/highered/product/simulation-modeling-and-analysis-law.html?viewOption=instructor
[3] Matloff, N. (2008). Introduction to discrete-event simulation and the simpy language. Davis, CA. Dept of Computer Science. University of California at Davis. Retrieved on August, 2(2009), 1-33. https://heather.cs.ucdavis.edu/matloff/public_html/156/PLN/DESimIntro.pdf
[4] Kleijnen, J. P. (2015, September). Design and analysis of simulation experiments. In International workshop on simulation (pp. 3-22). Cham: Springer International Publishing. https://doi.org/10.1007/978-3-319-76035-3_1
[5] Stodden, Victoria, Marcia McNutt, David H. Bailey, et al. 2016. “Enhancing Reproducibility for Computational Methods.” Science 354 (6317). https://doi.org/10.1126/science.aah6168.
[6] Distribution fitting with Python: https://medium.com/@amirarsalan.rajabi/distribution-fitting-with-python-scipy-bb70a42c0aed
[7] https://fitter.readthedocs.io/en/latest/
[8] Massey Jr, F. J. (1951). The Kolmogorov-Smirnov test for goodness of fit. Journal of the American statistical Association, 46(253), 68-78.
Changelog
Version 3.0.0
- DESK-DistFit upgrade of distribution with scipy to python functions
Version 2.0.0
- Complete rewrite DESK CLI interface
Version 1.1.2
- Complete rewrite DESK-DistFit CLI interface
Version 1.1.0
- Complete rewrite with object-oriented design
- Added command-line interface
- Multiple output formats support
- Enhanced error handling and logging
- Improved visualization
Version 1.0.0
- Initial release
- Basic distribution fitting functionality
- Simple plotting capabilities
🤝 Contributing
Contributions are welcome:
- Fork the repository
- Create a feature branch
- Commit your changes
- Open a Pull Request
📄 License
GPL-3.0 License — see LICENSE file.
- The DESK documentation are licensed under Creative Commons
Attribution 4.0 (CC BY 4.0).
👨🏫 Acknowledgements
Author: Prof. João Flávio de Freitas Almeida joao.flavio@dep.ufmg.br
Graduate Program: PPGEP — UFMG (Brazil)
Course: Simulating Logistics Systems
Credits: * SimPy (Python) * bupaR, processAnimate (R)
📚 Citation
If you use DESK in academic work, please cite:
@software{desk2025almeida,
  author = {Almeida, João Flávio de Freitas},
  title = {DESK: Discrete Event Simulation Kit},
  year = {2025},
  institution = {PPGEP-UFMG},
  url = {https://desk-sim.readthedocs.io/en/latest/}
}